dashbrew
       /$$                     /$$       /$$
      | $$                    | $$      | $$
  /$$$$$$$  /$$$$$$   /$$$$$$$| $$$$$$$ | $$$$$$$   /$$$$$$   /$$$$$$  /$$  /$$  /$$
 /$$__  $$ |____  $$ /$$_____/| $$__  $$| $$__  $$ /$$__  $$ /$$__  $$| $$ | $$ | $$
| $$  | $$  /$$$$$$$|  $$$$$$ | $$  \ $$| $$  \ $$| $$  \__/| $$$$$$$$| $$ | $$ | $$
| $$  | $$ /$$__  $$ \____  $$| $$  | $$| $$  | $$| $$      | $$_____/| $$ | $$ | $$
|  $$$$$$$|  $$$$$$$ /$$$$$$$/| $$  | $$| $$$$$$$/| $$      |  $$$$$$$|  $$$$$/$$$$/
 \_______/ \_______/|_______/ |__/  |__/|_______/ |__/       \_______/ \_____/\___/
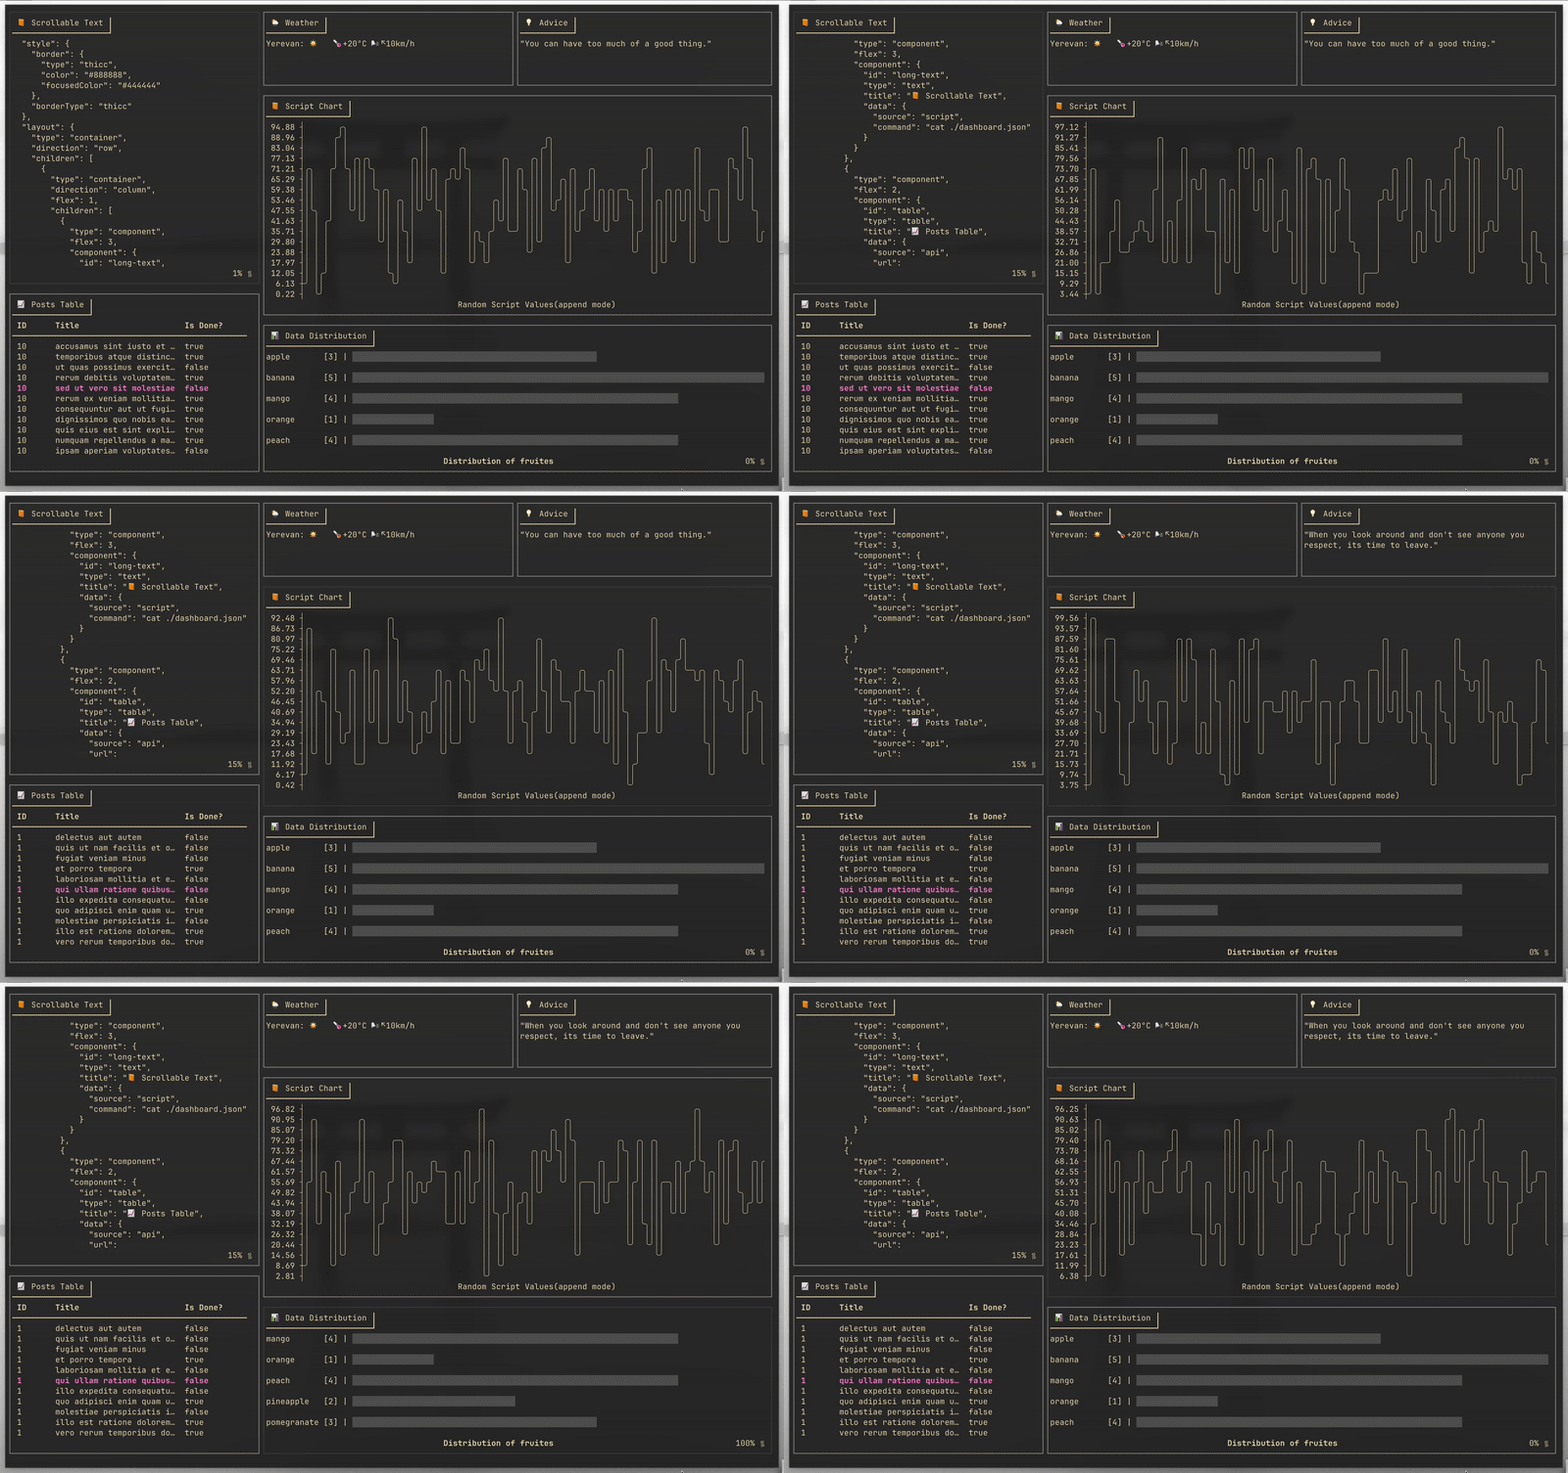
Dashbrew is a terminal dashboard builder that lets you visualize data from scripts and APIs right in your console, using a simple JSON configuration. Stay informed without leaving your terminal!

🚀 Installation
Using Go Install
go install github.com/rasjonell/dashbrew/cmd/dashbrew@latest
From Source
# Clone the repository
git clone https://github.com/rasjonell/dashbrew.git
cd dashbrew

# Build and install
go install ./cmd/dashbrew
Quick Start
- Create a simple dashboard configuration file(
dashboard.json):{ "style": { "border": { "type": "thicc", "color": "#cccccc", "focusedColor": "#474747" } }, "layout": { "type": "container", "direction": "row", "children": [ { "type": "component", "flex": 1, "component": { "type": "text", "title": "Hello Dashbrew", "data": { "source": "script", "command": "echo 'Welcome to Dashbrew!'" } } } ] } } - run:
dashbrew -c dashboard.json
Complete Documentation
For comprehensive documentation on all features, please refer to our GitHub Wiki:
Basic Examples
Display API Data
Show real-time data from an API:
{
  "type": "component",
  "component": {
    "type": "text",
    "title": "🌦️ Weather",
    "data": {
      "source": "api",
      "url": "https://wttr.in/<YOUR_CITY>?format=4",
      "refresh_interval": 60
    }
  }
}
Creating a ToDo List
Create a todo.txt file:
- finish work
+ laundry
+ dishes
Add it to your dashboard:
{
  "type": "component",
  "component": {
    "type": "todo",
    "title": "📋 My Todo List",
    "data": {
      "source": "./todo.txt"
    }
  }
}
Creating a Chart
Visualize Data with charts:
{
  "type": "component",
  "component": {
    "type": "chart",
    "title": "📊 System Metrics",
    "data": {
      "source": "script",
      "command": "echo '10\n25\n15\n30\n45'",
      "refresh_interval": 5,
      "caption": "CPU Usage (%)"
    }
  }
}
Create a Histogram
Show distributions with histograms:
{
  "type": "component",
  "component": {
    "type": "histogram",
    "title": "📊 Age Distribution",
    "data": {
      "source": "script",
      "command": "echo '\"18-24\": 45\n\"25-34\": 78\n\"35-44\": 52\n\"45-54\": 34\n\"55+\": 21'",
      "caption": "Users by Age Group"
    }
  }
}
Basic Navigation
Shift+ArroworShift+H/J/K/L: Move between componentsA: Add item (in todo lists)Space: Toggle item state (in todo lists)R: Refresh data for the focused componentCtrl+C: Quit